The Strat [LuxAlgo]The Strat indicator is a full toolkit regarding most of the concepts within "The Strat" methodology with features such as candle numbering, pivot machine gun (PMG) highlighting, custom combo highlighting, and various statistics included.
Alerts are also included for the detection of specific candle numbers, custom combos, and PMGs.
🔶 SETTINGS
Show Numbers on Chart: Shows candle numbering on the chart.
Style Candles: Style candles based on the detected number. Only effective on non-line charts and if the script is brought to the front.
🔹 Custom Combo Search
Combo: User defined combo to be searched by the script. Combos can be composed of any series of numbers including (1, 2, -2, 3), e.g : 2-21. No spaces or other characters should be used.
🔹 Pivot Machine Gun
Show Labels: Highlight detected PMGs with a label.
Min Sequence Length: Minimum sequence length of consecutive higher lows/lower highs required to detect a PMG.
Min Breaks: Minimum amount of broken previous highs/lows required to detect a PMG.
Show Levels: Show levels of the broken highs/lows.
🔹 Pivot Combos
Pivot Lookback: Lookback period used for detecting pivot points.
Right Bars Scan: Number of bars scanned to the right side of a detected pivot.
Left Bars Scan: Number of bars scanned to the left side of a detected pivot.
🔹 Dashboard
Show Dashboard: Displays statistics dashboard on chart.
Numbers Counter: Displays the numbers counter section on the dashboard.
Pivot Combos: Displays pivots combo section on the dashboard.
%: Display the percentage of detected pivot combos on the dashboard instead of absolute numbers.
Pivot Combos Rows: Number of rows displayed by the "Pivots Combo" dashboard section.
Show MTF: Showa MTF candle numbering on the dashboard.
Location: Location of the dashboard on the chart.
Size: Size of the displayed dashboard.
🔶 USAGE
This script allows users with an understanding of The Strat to quickly highlight elements such as candle numbers, pivot machine guns, and custom combos. The usage for these concepts is given in the sub-sections below.
🔹 Candle Numbers
The Strat assigns a number to individual candles, this number is determined by the current candle position relative to the precedent candle, these include:
Number 1 - Inside bar, occurs when the previous candle range engulfs the current one.
Number 2 Up - Upside Directional Bar, occurs when the current price high breaks the previous high while the current low is lower than the previous high.
Number 2 Down - Downside Directional Bar, occurs when the current price low breaks the previous low while the current high is higher than the previous low.
Number 3 - Outside bar, occurs when the current candle range engulfs the previous one.
The script can highlight the number of a candle by using labels but can also style candles by depending on the candle number. Inside bars (1) only have their candle wick highlighted, directional bars (2) (-2) only have their candle body highlighted. Outside bars have their candle range highlighted.
Note that downside directional bars are highlighted with the number -2.
Users can see the total amount of times a specific candle number is detected on the historical data on the dashboard available within the settings, as well as the number of times a candle number is detected relative to the total amount of detected candle numbers expressed as a percentage.
It is also possible to see the current candle numbers returned by multiple timeframes on the dashboard.
🔹 Searching For Custom Combos
Combos are made of a sequence of two or more candle numbers. These combos can highlight multiple reversals/continuation scenarios. Various common combos are documented by The Strat community.
This script allows users to search for custom combos by entering them on the Combo user setting field.
When a user combo is found, it is highlighted on the chart as a box highlighting the combo range.
🔹 Pivot Combos
It can be of interest to a user to display the combo associated with a pivot high/low. This script will highlight the location of pivot points on the chart and display its associated combo by default. These are based on the Pivot Combo lookback and not displayed in real-time.
Users can see on the dashboard the combos associated with a pivot high/low, these are ranked by frequency.
🔹 Pivot Machine Gun (PMG)
Pivot Machine Guns (PMG)s describe the scenario where a single price variation breaks the value of multiple past successive higher lows/lower highs. This can highlight a self-exciting behavior, where even more past successive higher lows/lower highs get broken.
Users can select the minimum sequence length of successive higher lows/lower highs required for a PMG to be detected, as well the amount of these successive higher lows/lower highs that must be broken.
חפש סקריפטים עבור "inside bar"

Edward PriceAction
This is an updated version of my previous script, I have added a few extra Patterns and some patterns specs have chnaged over those specified by "Price Action Battle Station by theforexguy".
Because this script has diverted from the original specification of "theforexguy", I have decided to release it as a new version. Improvements have been made to some of the pattern finding calculations, for example Hammer and Shooting Stars are now special Pin Bars, they now must have preceding and succeeding confirm bars, so they do not occur very often.
NOTE: All the identification of PA candles is disabled by default.
Changes made in Version 2.0 :
Added Forex Morning and Evening Stars (the centre small candle is not a specific color).
Abbreviated text names for less cluttered look.
Change minimum/maximum bar sizes to be a % of current ATR, rather than pips, this makes relative sizing independent on Time Frame, and make the script work better with non-currency assets like stocks and commodities .
Change definition of Hammer and shooting Star so the the previous candle is part of a trend and is followed by a confirm candle.
Added some precendence test to reduce multiple action labels.
版本注释: After some feedback from fellow traders I have made the following changes:
Definition for Outside Bar now does not require the previous bar to be opposite Colour (this the same as Inside Bars), but added a requirement for minimum size ratio compared to previous Bar (set to 1.1 by default). If you require previous Bar to be opposite colour, you could use Engulfing candles with Outside Bar option enabled.
Added Maximum size ratio requirement for Inside Bars (set to 0.9 by default).
版本注释: Minor Update.
Added OverSized candle Pattern, the pattern is labelled when candle is some ratio (default 5) bigger than current ATR of chart time frame.
Added Option to Change ATR Length.
版本注释: Patch
Correct Polarity of Oversize Bar labelling.
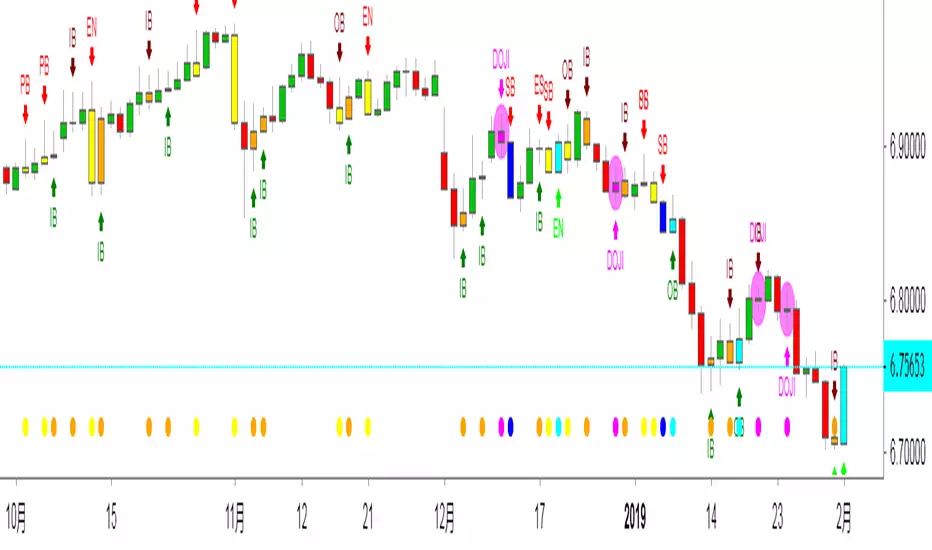
中文解释:
价格行为交易,此指标能够显示出来K线所代表的意思,比如PB就是PINBAR的意思 就是倒锤头线,反转概率大于延续概率。
OB就是吞没的意思,不管是阴吞没还是阳吞没 我们根据PA入场就行,标准是回撤50%入场。而ODJI就是黄昏星,启明星的意思。
这个指标在添加的时候是空白的,需要人工去点设置,把需要使用的功能打上钩钩确认。这样就能够在图表上面显示出来了。
如果不希望显示彩色K线同样也可以设置哈!
数值和样式都 可以设置,在不懂指标的前提下推荐使用默认设置。只负责打勾勾就行。确认后就能够看到图表上面显示的指标了。

By Traders For TradersThis is an updated version of my previous script, I have added a few extra Patterns and some patterns specs have chnaged over those specified by "Price Action Battle Station by theforexguy".
Because this script has diverted from the original specification of "theforexguy", I have decided to release it as a new version. Improvements have been made to some of the pattern finding calculations, for example Hammer and Shooting Stars are now special Pin Bars, they now must have preceding and succeeding confirm bars, so they do not occur very often.
NOTE: All the identification of PA candles is disabled by default.
Changes made in Version 2.0 :
Added Forex Morning and Evening Stars (the centre small candle is not a specific color).
Abbreviated text names for less cluttered look.
Change minimum/maximum bar sizes to be a % of current ATR, rather than pips, this makes relative sizing independent on Time Frame, and make the script work better with non-currency assets like stocks and commodities .
Change definition of Hammer and shooting Star so the the previous candle is part of a trend and is followed by a confirm candle.
Added some precendence test to reduce multiple action labels.
版本注释: After some feedback from fellow traders I have made the following changes:
Definition for Outside Bar now does not require the previous bar to be opposite Colour (this the same as Inside Bars), but added a requirement for minimum size ratio compared to previous Bar (set to 1.1 by default). If you require previous Bar to be opposite colour, you could use Engulfing candles with Outside Bar option enabled.
Added Maximum size ratio requirement for Inside Bars (set to 0.9 by default).
版本注释: Minor Update.
Added OverSized candle Pattern, the pattern is labelled when candle is some ratio (default 5) bigger than current ATR of chart time frame.
Added Option to Change ATR Length.
版本注释: Patch
Correct Polarity of Oversize Bar labelling.
The Strat The Strat Bar Type Identifier – Pure Price Action Logic
This open-source indicator implements the foundational bar classification of "The Strat" method developed by Rob Smith. It identifies each candle on the chart as one of the three core types used in The Strat:
* Inside Bar (1): The candle’s range is fully within the previous candle’s range. This indicates consolidation or balance and often precedes breakouts or reversals.
* Two-Up Bar (2U): The current candle breaks the previous high but does not break its low. This is considered bullish directional movement.
* Two-Down Bar (2D): The current candle breaks the previous low but not the high. This signals bearish directional movement.
* Outside Bar (3): The candle breaks both the high and the low of the previous candle, signaling a broadening formation and high volatility.
The script plots a character below each candle based on its type:
* "1" for Inside Bar
* "2" for Two-Up or Two-Down (color-coded)
* "3" for Outside Bar
This tool helps traders quickly identify actionable setups according to The Strat method and serves as a foundation for more advanced strategies like the 3-1-2 reversal or 1-2-2 continuation.
All calculations are based purely on price action—no indicators, no smoothing, no lagging elements. It is ideal for traders looking to understand price structure and bar sequencing from a Strat perspective.
To use:
1. Add the indicator to any chart and timeframe.
2. Look for the numbers below the candles.
3. Analyze the sequence of bar types to spot Strat setups.
This script is educational and can be extended with multi-timeframe context, FTFC logic, actionable signals, or broadening formation detection.
Clean, minimal, and faithful to the core principles of The Strat.

TriAnchor Elastic Reversion US Market SPY and QQQ adaptedSummary in one paragraph
Mean-reversion strategy for liquid ETFs, index futures, large-cap equities, and major crypto on intraday to daily timeframes. It waits for three anchored VWAP stretches to become statistically extreme, aligns with bar-shape and breadth, and fades the move. Originality comes from fusing daily, weekly, and monthly AVWAP distances into a single ATR-normalized energy percentile, then gating with a robust Z-score and a session-safe gap filter.
Scope and intent
• Markets: SPY QQQ IWM NDX large caps liquid futures liquid crypto
• Timeframes: 5 min to 1 day
• Default demo: SPY on 60 min
• Purpose: fade stretched moves only when multi-anchor context and breadth agree
• Limits: strategy uses standard candles for signals and orders only
Originality and usefulness
• Unique fusion: tri-anchor AVWAP energy percentile plus robust Z of close plus shape-in-range gate plus breadth Z of SPY QQQ IWM
• Failure mode addressed: chasing extended moves and fading during index-wide thrusts
• Testability: each component is an input and visible in orders list via L and S tags
• Portable yardstick: distances are ATR-normalized so thresholds transfer across symbols
• Open source: method and implementation are disclosed for community review
Method overview in plain language
Base measures
• Range basis: ATR(length = atr_len) as the normalization unit
• Return basis: not used directly; we use rank statistics for stability
Components
• Tri-Anchor Energy: squared distances of price from daily, weekly, monthly AVWAPs, each divided by ATR, then summed and ranked to a percentile over base_len
• Robust Z of Close: median and MAD based Z to avoid outliers
• Shape Gate: position of close inside bar range to require capitulation for longs and exhaustion for shorts
• Breadth Gate: average robust Z of SPY QQQ IWM to avoid fading when the tape is one-sided
• Gap Shock: skip signals after large session gaps
Fusion rule
• All required gates must be true: Energy ≥ energy_trig_prc, |Robust Z| ≥ z_trig, Shape satisfied, Breadth confirmed, Gap filter clear
Signal rule
• Long: energy extreme, Z negative beyond threshold, close near bar low, breadth Z ≤ −breadth_z_ok
• Short: energy extreme, Z positive beyond threshold, close near bar high, breadth Z ≥ +breadth_z_ok
What you will see on the chart
• Standard strategy arrows for entries and exits
• Optional short-side brackets: ATR stop and ATR take profit if enabled
Inputs with guidance
Setup
• Base length: window for percentile ranks and medians. Typical 40 to 80. Longer smooths, shorter reacts.
• ATR length: normalization unit. Typical 10 to 20. Higher reduces noise.
• VWAP band stdev: volatility bands for anchors. Typical 2.0 to 4.0.
• Robust Z window: 40 to 100. Larger for stability.
• Robust Z entry magnitude: 1.2 to 2.2. Higher means stronger extremes only.
• Energy percentile trigger: 90 to 99.5. Higher limits signals to rare stretches.
• Bar close in range gate long: 0.05 to 0.25. Larger requires deeper capitulation for longs.
Regime and Breadth
• Use breadth gate: on when trading indices or broad ETFs.
• Breadth Z confirm magnitude: 0.8 to 1.8. Higher avoids fighting thrusts.
• Gap shock percent: 1.0 to 5.0. Larger allows more gaps to trade.
Risk — Short only
• Enable short SL TP: on to bracket shorts.
• Short ATR stop mult: 1.0 to 3.0.
• Short ATR take profit mult: 1.0 to 6.0.
Properties visible in this publication
• Initial capital: 25000USD
• Default order size: Percent of total equity 3%
• Pyramiding: 0
• Commission: 0.03 percent
• Slippage: 5 ticks
• Process orders on close: OFF
• Bar magnifier: OFF
• Recalculate after order is filled: OFF
• Calc on every tick: OFF
• request.security lookahead off where used
Realism and responsible publication
• No performance claims. Past results never guarantee future outcomes
• Fills and slippage vary by venue
• Shapes can move during bar formation and settle on close
• Standard candles only for strategies
Honest limitations and failure modes
• Economic releases or very thin liquidity can overwhelm mean-reversion logic
• Heavy gap regimes may require larger gap filter or TR-based tuning
• Very quiet regimes reduce signal contrast; extend windows or raise thresholds
Open source reuse and credits
• None
Strategy notice
Orders are simulated by TradingView on standard candles. request.security uses lookahead off where applicable. Non-standard charts are not supported for execution.
Entries and exits
• Entry logic: as in Signal rule above
• Exit logic: short side optional ATR stop and ATR take profit via brackets; long side closes on opposite setup
• Risk model: ATR-based brackets on shorts when enabled
• Tie handling: stop first when both could be touched inside one bar
Dataset and sample size
• Test across your visible history. For robust inference prefer 100 plus trades.

HBK Price Action Strategy HBKPrice Action Strategy for XAUUSD with a Favorable Risk-Reward Ratio
Understanding the Strategy:
This strategy leverages price action principles to identify potential entry and exit points for XAUUSD on a 5-minute timeframe. The core idea is to identify price action patterns that suggest a high probability of a particular direction, and then to set stop-loss and take-profit levels to manage risk and reward.
Key Price Action Patterns to Watch:
Pin Bar: A pin bar is a candlestick with a long wick in one direction and a small body in the opposite direction. It often signals a reversal in the current trend.
Inside Bar: An inside bar forms when the current candle's high is lower than the previous candle's high, and the current candle's low is higher than the previous candle's low. It often indicates indecision or a potential breakout.
Engulfing Pattern: An engulfing pattern occurs when the current candle completely engulfs the previous candle. A bullish engulfing pattern signals a potential uptrend, while a bearish engulfing pattern signals a potential downtrend.
Risk-Reward Ratio:
A favorable risk-reward ratio is crucial for long-term trading success. Aim for a minimum risk-reward ratio of 1:2, meaning you risk $1 to potentially gain $2.
Entry and Exit Signals:
Long Entry:
Identify a bullish pin bar or engulfing pattern.
Wait for a confirmation candle to close above the pin bar's high or the engulfing pattern's high.
Place a stop-loss below the recent swing low.
Set a take-profit target at a key resistance level or a multiple of the stop-loss distance.
Short Entry:
Identify a bearish pin bar or engulfing pattern.
Wait for a confirmation candle to close below the pin bar's low or the engulfing pattern's low.
Place a stop-loss above the recent swing high.
Set a take-profit target at a key support level or a multiple of the stop-loss distance.
Additional Tips:
Use Support and Resistance Levels: Identify key support and resistance levels to set your stop-loss and take-profit targets.
Consider Market Sentiment: Pay attention to market sentiment and news events that may impact gold prices.
Manage Risk: Always use stop-loss orders to limit potential losses.
Be Patient: Don't force trades. Wait for high-probability setups.
Practice Discipline: Stick to your trading plan and avoid impulsive decisions.
Remember:
Price action trading requires practice and patience.
Backtest your strategy on historical data to refine your approach.
Always adapt to changing market conditions.
By following these guidelines and practicing disciplined risk management, you can increase your chances of success in trading XAUUSD on a 5-minute timeframe.

Body-Based Inside/Outside Bars (wicks excluded)This indicator shows inside/outside bars EXCLUDING the wicks. The yellow vertical line indicates an inside bar (body only) and the blue vertical line indicates outside bars (candle body only).

Higher Time Frame Fair Value Gap [ZeroHeroTrading]A fair value gap (FVG) highlights an imbalance area between market participants, and has become popular for technical analysis among price action traders.
A bullish (respectively bearish) fair value gap appears in a triple-candle pattern when there is a large candle whose previous candle’s high (respectively low) and subsequent candle’s low (respectively high) do not fully overlap the large candle. The space between these wicks is known as the fair value gap.
The following script aims at identifying higher timeframe FVG's within a lower timeframe chart. As such, it offers a unique perspective on the formation of FVG's by combining the multiple timeframe data points in the same context.
You can change the indicator settings as you see fit to achieve the best results for your use case.
Features
It draws higher timeframe bullish and bearish FVG's on the chart.
For bullish (respectively bearish) higher timeframe FVG's, it adds the buying (respectively selling) pressure as a percentage ratio of the up (respectively down) volume of the second higher timeframe bar out of the total up (respectively down) volume of the first two higher timeframe bars.
It adds a right extended trendline from the most recent lowest low (respectively highest high) to the top (respectively bottom) of the higher timeframe bullish (respectively bearish) FVG.
It detects and displays higher timeframe FVG's as early as one starts forming.
It detects and displays lower timeframe (i.e. chart's timeframe) FVG's upon confirmation.
It allows for skipping inside first bars when evaluating FVG's.
It allows for dismissing higher timeframe FVG's if there is no update for any period of the chart's timeframe. For instance, this can occur at lower timeframes during low trading activity periods such as extended hours.
Settings
Higher Time Frame FVG dropdown: Selects the higher timeframe to run the FVG detection on. Default is 15 minutes. It must be higher than, and a multiple of, the chart's timeframe.
Higher Time Frame FVG color select: Selects the color of the text to display for higher timeframe FVG's. Default is black.
Show Trend Line checkbox: Turns on/off trendline display. Default is on.
Show Lower Time Frame FVG checkbox: Turns on/off lower timeframe (i.e. chart's timeframe) FVG detection. Default is on.
Show Lower Time Frame FVG color select: Selects the color of the border for lower timeframe (i.e. chart's timeframe) FVG's. Default is white.
Include Inside Bars checkbox: Turns on/off the inclusion of inside first bars when evaluating FVG's. Default is on.
With Consistent Updates checkbox: Turns on/off consistent updates requirement. Default is on.

Inside Candle alert V1 By HARSH DEO SINGHA breakout long signal is generated when the current high crosses above the previous mother bar's high, and it's an inside bar.
A breakdown short signal is generated when the current low crosses below the previous mother bar's low, and it's an inside bar.
The script plots triangle shapes below breakout long signals and above breakdown short signals.
Alert conditions are added for inside bars, breakout long, and breakdown short.
Please note that this is a basic example, and you can further refine and optimize your strategy based on your specific trading rules and preferences. Always remember to backtest and paper trade any strategy before using it with real money.

Intrabar Volume Distribution [BigBeluga]Intrabar Volume Distribution is an advanced volume and order flow indicator that visualizes the buy and sell volume distribution within each candlestick.
🔔 Before Use:
Turn off the background color of your candles for clear visibility.
Overlay the indicator on the top layout to ensure accurate alignment with the price chart.
🔵 Key Features:
Inside Bar Volume Visualization:
Each candlestick is divided into two columns:
Left column displays the sell % volume amount.
Right column displays the buy % volume amount.
Provides a clear representation of buyer-seller activity within individual bars.
Percentage Volume Labels:
Labels above each bar show the percentage share of sell and buy volume relative to the total (100%).
Quickly assess market sentiment and volume imbalances.
Point of Control (POC) Levels:
Orange dashed lines mark the POC inside each bar, indicating the price level with the highest traded volume.
Helps identify key liquidity zones within individual candlesticks.
Multi-Timeframe Volume Analysis:
The indicator automatically uses a timeframe 20-30 times lower than the current one to gather detailed volume data.
For each higher timeframe candle, it collects 20-30 bars of lower timeframe data for precise volume mapping.
Each bar is divided into 100 volume bins to capture detailed volume distribution across the price range.
Bins are filled based on the aggregated volume from the lower timeframe data.
Lookback Period:
Allows traders to select how many bars to display with delta and volume information.
The beginning of the selected lookback period is marked with a gray line and label for quick reference.
Indicator displays up to 80 bars back
🔵 Usage:
Order Flow Analysis: Monitor buy/sell volume distribution to spot potential reversals or continuations.
Liquidity Identification: Use POC levels to locate areas of strong market interest and potential support/resistance.
Volume Imbalance Detection: Pay attention to percentage labels for quick recognition of buyer or seller dominance.
Scalping & Intraday Trading: Ideal for traders seeking real-time insight into order flow and volume behavior.
Historical Analysis: Adjust the lookback period to analyze past price action and volume activity.
Intrabar Volume Distribution is a powerful tool for traders aiming to gain deeper insight into market sentiment through detailed volume analysis, allowing for more informed trading decisions based on real-time order flow dynamics.

RM StratThis is my attempt to code up the rules of "The Strat." I've seen other scripts that do parts of what my script does, but this script combines all of them into one script and allows the user control over how they interact with each other.
What's in this indicator?
Show the Strat Candle Numbers (1 - inside bar, 2 - continuation bar, 3 - outside bar) on the chart.
Show a widget off to the right of the chart for multi-timeframe analysis. This widget tells you whether the D/W/M/Q candles are currently green or red as well as the Candle type (White Circle - (1) Inside Bar, Up Green Arrow - (2U) Continuation Bar, Down Red Arrow - (2D) Continuation Bar, Green/Red Square - (3) Outside Bar)
Integrates the long and short rules into the chart. These can also be turned off if you don't want to see them. Note: this is a simplified version of these rules - if you look at the cheat sheets floating around the internet, you'll notice that all trade initiations occur on a break of the high (for longs) or low (for shorts) of the previous candle as long as that previous candle was not a 2. So that's my only rule for going long or short. I think it matches well with the cheat sheets but is way simpler to code and to think of how it works. The other benefit is it shows you failed trades that the cheat sheet won't catch - where a 2 becomes a 3 in the other direction and stops you out. You'll see that now with this script.
Ability to filter out the long/short rules based on the timeframe continuity of the higher timeframe candles. This is user-configurable so that you can experiment with timeframe continuity and see how strict you want to be with this on your trades.
Show the high/low of the Day, Week, and Month on your chart as horizontal lines that you can use as a reference. This could be used for planning profit targets or seeing how likely a reversal might indicate moving into timeframe continuity.

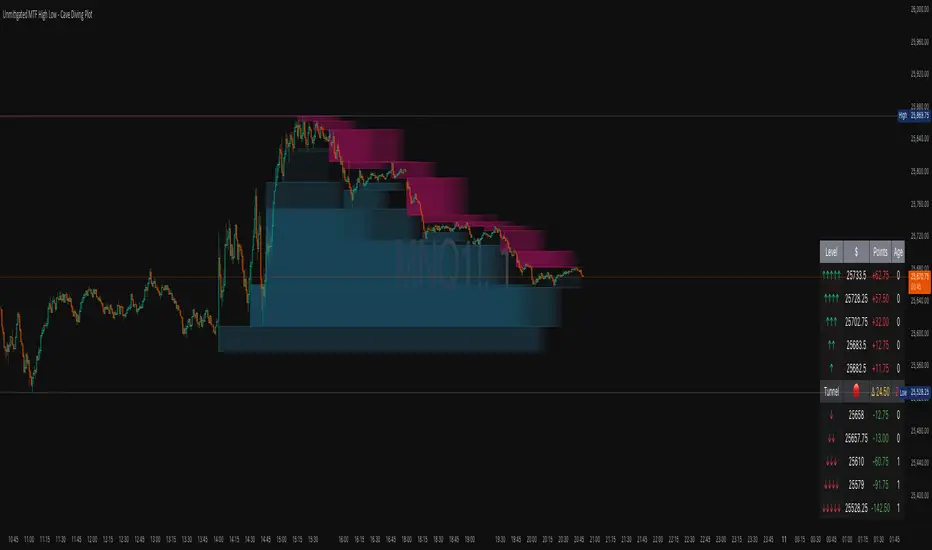
Unmitigated MTF High Low - Cave Diving Plot
IntroductionThe Unmitigated MTF High Low -
Cave Diving Plot is a multi-timeframe (MTF) indicator designed for NQ and ES futures traders who want to identify high-probability entry and exit zones based on unmitigated price levels. The "Cave Diving" visualization helps you navigate between support (floor) and resistance (ceiling) zones, while the integrated Strat analysis provides directional context.
Who Is This For?
Futures traders (NQ, ES) trading during ETH and RTH sessions
Scalpers and day traders looking for precise entry/exit levels
Traders using The Strat methodology for directional analysis
Anyone seeking confluence between price action and key levels
Core Concepts
1. Unmitigated Level:
An unmitigated level is a price high or low that has been created but not yet tested (touched) by price. These levels act as magnets - price often returns to test them.Key Properties:
Resistance (Highs): Price has created a high but hasn't revisited it
Support (Lows): Price has created a low but hasn't revisited it
Mitigation: When price touches a level, it becomes "mitigated" and loses strength
2. The Cave Diving MetaphorThink of trading as cave diving between two zones:
┌─────────────────────────────────┐
│ CEILING (Upper Band) │ ← 1st & 2nd Unmitigated Highs
│ 🟥 Resistance Zone │
├─────────────────────────────────┤
│ │
│ THE TUNNEL │ ← Price navigates here
│ (Trading Channel) │
│ │
├─────────────────────────────────┤
│ 🟢 Support Zone │
│ FLOOR (Lower Band) │ ← 1st & 2nd Unmitigated Lows
└─────────────────────────────────┘
Trading Concept:
Ceiling: Formed by the 1st and 2nd most recent unmitigated highs
Floor: Formed by the 1st and 2nd most recent unmitigated lows
Tunnel: The space between ceiling and floor where price operates
Cave Diving: Navigating between these zones for entries and exits
3. Session-Based Age TrackingLevels are tracked by session age:
Session: 6:00 PM to 5:00 PM NY time (23-hour window)
Age 0: Created in the current session (today)
Age 1: Created 1 session ago (yesterday)
Age 2+: Older levels (more significant)
Why Age Matters:
Older unmitigated levels are typically stronger magnets
Fresh levels (Age 0) may be weaker and easier to break
Age 2+ levels often provide high-probability reversal zones
Indicator Components
Visual Elements
1. Colored Bands (Cave Zones)Upper Band (Pink/Maroon - 95% transparency)
Space between 1st and 2nd unmitigated highs
Acts as resistance zone
Price often hesitates or reverses here
Lower Band (Teal - 95% transparency)
Space between 1st and 2nd unmitigated lows
Acts as support zone
Price often finds buyers here
2. Information Table Located in your chosen corner (default: Bottom Right), the table displays:
5 most recent unmitigated highs (top section)
Tunnel row (middle separator)
5 most recent unmitigated lows (bottom section)
Reading the TableTable Structure
┌────────┬──────────┬────────┬───────┐
│ Level │ $ │ Points │ Age │
├────────┼──────────┼────────┼───────┤
│ ↑↑↑↑↑ │ 21,450.25│ +45.30 │ 3 │ ← 5th High (oldest)
│ ↑↑↑↑ │ 21,425.50│ +32.75 │ 2 │ ← 4th High
│ ↑↑↑ │ 21,410.00│ +25.00 │ 1 │ ← 3rd High
│ ↑↑ │ 21,400.75│ +18.50 │ 1 │ ← 2nd High
│ ↑ │ 21,395.25│ +12.00 │ 0 │ ← 1st High (newest)
├────────┼──────────┼────────┼───────┤
│ Tunnel │ 🟢 │ Δ 85.50│ 2U │ ← Current State
├────────┼──────────┼────────┼───────┤
│ ↓ │ 21,310.00│ -15.25 │ 0 │ ← 1st Low (newest)
│ ↓↓ │ 21,295.50│ -22.75 │ 1 │ ← 2nd Low
│ ↓↓↓ │ 21,280.25│ -30.00 │ 1 │ ← 3rd Low
│ ↓↓↓↓ │ 21,265.75│ -38.50 │ 2 │ ← 4th Low
│ ↓↓↓↓↓ │ 21,250.00│ -45.00 │ 3 │ ← 5th Low (oldest)
└────────┴──────────┴────────┴───────┘Column
Breakdown
Column 1: Level (Arrows)
Green arrows (↑): Resistance levels above current price
Red arrows (↓): Support levels below current price
Arrow count: Indicates recency (1 arrow = newest, 5 arrows = oldest)
Why This Matters:
More arrows = older level = stronger magnet for price
Column 2: $ (Price)
Exact price of the unmitigated level
Use this for limit orders and stop placement
Column 3: Points (Distance)
Positive (+) for highs: Points above current price
Negative (-) for lows: Points below current price
Helps gauge proximity to key levels
Trading Application:
If you're +2.50 points from resistance, a reversal may be imminent
If you're -45.00 points from support, you're far from the floor
Column 4: Age (Sessions)
Number of full 6pm-5pm sessions the level has survived
Age 0: Created today (current session)
Age 1+: Created in previous sessions
Significance Ladder:
Age 0: Weak, may break easily
Age 1-2: Medium strength
Age 3+: Strong, high-probability reaction zone
Tunnel Row (Critical Information)│ Tunnel │ 🟢 │ Δ 85.50│ 2U │
└─┬─┘ └─┬─┘ └──┬──┘ └─┬─┘
│ │ │ │
Label Direction Range Strat
1. Tunnel Label: Identifies the separator row
2. Direction Indicator (🟢/🔴)
🟢 Green Circle: Current 15m bar closed bullish (above previous close)
🔴 Red Circle: Current 15m bar closed bearish (below previous close)
3. Δ (Delta/Range)
Distance in points between 1st High and 1st Low
Shows the tunnel width (trading range)
Example: Δ 85.50 = 85.50 points between ceiling and floor
Trading Use:
Wide tunnel (>100 points): More room to trade, consider range strategies
Narrow tunnel (<50 points): Tight range, expect breakout
4. Strat Pattern
1: Inside bar (consolidation)
2U: 2 Up (bullish directional bar)
2D: 2 Down (bearish directional bar)
3: Outside bar (expansion/volatility)
Color Coding:
Green: 2U (bullish)
Red: 2D (bearish)
Yellow: 3 (expansion)
Gray: 1 (inside/neutral)
Effort vs Result TRFxThe Effort vs Result (EVR) indicator is designed to identify high-probability reversal signals based on volume and price action dynamics. It highlights points where the market “effort” (high volume) does not correspond to an immediate “result” (price continuation), providing actionable trade setups for both bullish and bearish scenarios.
Features:
Detects bullish EVR signals when a previous high-volume sell candle is followed by a strong bullish candle that sweeps the previous low.
Detects bearish EVR signals when a previous high-volume buy candle is followed by a strong bearish candle that sweeps the previous high.
Sticky arrows plot automatically above or below the candle, ensuring the signal moves with the price bar.
Considers inside bars, wick size, and relative volume to filter low-quality setups.
Fully compatible with multiple timeframes.
Inputs:
Volume Multiplier: Sets how much higher the current candle’s volume should be compared to the previous candle to count as high volume.
Min Wick % of Candle: Minimum wick size relative to the candle body to filter insignificant bars.
Max Inside Bars to Ignore: Number of inside bars between the previous candle and the EVR candle to ignore minor consolidations.
Usage:
(Green Arrow): Enter long when a green arrow appears below the candle. Place stop-loss slightly below the previous swing low.
(Red Arrow): Enter short when a red arrow appears above the candle. Place stop-loss slightly above the previous swing high.
Can be combined with support/resistance levels, trendlines, or other technical indicators for higher accuracy.
Benefits:
Simple and clean visual signals with tiny arrows that move with candles.
Helps traders identify high-probability reversal points based on volume and price action.
Ideal for intraday and swing trading strategies.

LilSpecCodes1. Killzone Background Highlighting:
It highlights 4 key market sessions:
Killzone Time (EST) Color
Silver Bullet 9:30 AM – 12:00 PM Light Blue
London Killzone 2:00 AM – 5:00 AM Light Green
NY PM Killzone 1:30 PM – 4:00 PM Light Purple
Asia Open 7:00 PM – 11:00 PM Light Red
These are meant to help you focus during high-probability trading times.
__________________________________________________
2. Previous Day High/Low (PDH/PDL):
Plots green line = PDH
Plots red line = PDL
Tracks the current day’s session high/low and sets it as PDH/PDL on a new trading day
CHANGES WITH ETH/RTH
3. Inside Bar Marker:
Plots a small black triangle under bars where the high is lower than the previous bar’s high and the low is higher than the previous bar’s low (inside bars)
Useful for spotting potential breakout or continuation setups
4. Vertical Time Markers (White Dashed Lines)
Time (EST) Label
4:00 AM End of London Silver Bullet
9:30 AM NYSE Open
10:00 AM Start of NY Silver Bullet
11:00 AM End of NY Silver Bullet
11:30 AM (Customizable Input)
3:00 PM PM Killzone Ends
3:15 PM Futures Market Close
7:15 PM Asia Session Watch

Candle Range Detector by TradeTech AnalysisCandle Range Detector by TradeTech Analysis
This advanced indicator identifies and visualizes price compression zones based on inside bar formations, then tracks how price behaves around those zones — offering valuable insights into liquidity sweeps, range expansions, and trap/mitigation behavior.
The script builds upon the foundational concept of range-based price action, commonly used by institutional traders, and adds automation, mitigation tracking, and sweep detection to map how price reacts around these critical ranges.
🔍 How It Works:
• Range Formation: A new range is detected when the current candle forms entirely within the high and low of the previous candle (i.e., an inside bar). This behavior often indicates price compression and potential breakout zones.
• Range Extension: Once a range is confirmed, the script projects upper and lower boundaries (using either a percentage-based multiplier or Fibonacci log extension), providing context for expected breakout zones.
• Mitigation Tracking: The script continuously monitors whether price breaks above or below the projected extensions, marking that range as mitigated — useful for confirming whether liquidity was absorbed.
• Sweep Detection: If price re-visits a mitigated zone and shows signs of a liquidity sweep (via wick + close behavior), the indicator triggers visual sweep labels and optional alerts.
🧠 Optional Visual Enhancements:
• Highlight range-forming candles with light blue background (toggle on/off)
• Midpoint dotted line for symmetry analysis
• Labels for “Range High” and “Range Low” for visual clarity
• Dynamic box drawing that adapts upon mitigation or continuation
⚙️ Customizable Features:
• Choose between Normal and Fibonacci-based detection modes
• Toggle visibility of range boxes, extension lines, and sweep markers
• Configure sweep alerts, mitigation window size, and visual transparency
⸻
🧪 Use Cases
• Identify consolidation zones before major price moves
• Confirm liquidity sweeps for entry/exit traps
• Visualize and test mitigation behavior of past zones
• Combine with Order Flow or Volume Profile tools to enhance context
⸻
⚠️ This is a fully original implementation that goes beyond classical inside-bar scanners by incorporating mitigation, extension projection, and liquidity sweeps — making it a powerful tool for intraday, swing, and even Smart Money-based trading setups.

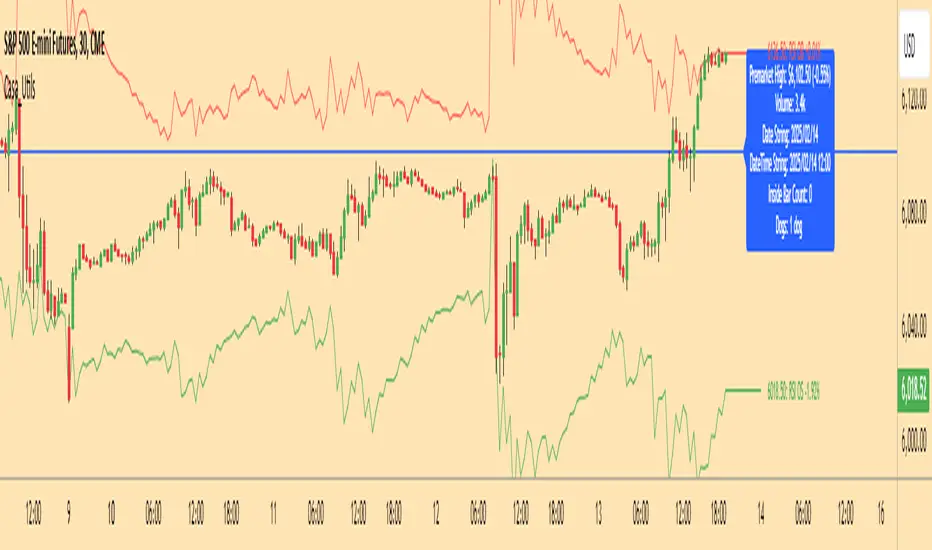
Casa_UtilsLibrary "Casa_Utils"
A collection of convenience and helper functions for indicator and library authors on TradingView
formatNumber(num)
My version of format number that doesn't have so many decimal places...
Parameters:
num (float) : The number to be formatted
Returns: The formatted number
getDateString(timestamp)
Convenience function returns timestamp in yyyy/MM/dd format.
Parameters:
timestamp (int) : The timestamp to stringify
Returns: The date string
getDateTimeString(timestamp)
Convenience function returns timestamp in yyyy/MM/dd hh:mm format.
Parameters:
timestamp (int) : The timestamp to stringify
Returns: The date string
getInsideBarCount()
Gets the number of inside bars for the current chart. Can also be passed to request.security to get the same for different timeframes.
Returns: The # of inside bars on the chart right now.
getLabelStyleFromString(styleString, acceptGivenIfNoMatch)
Tradingview doesn't give you a nice way to put the label styles into a dropdown for configuration settings. So, I specify them in the following format: "Center", "Left", "Lower Left", "Lower Right", "Right", "Up", "Upper Left", "Upper Right", "Plain Text", "No Labels". This function takes care of converting those custom strings back to the ones expected by tradingview scripts.
Parameters:
styleString (string)
acceptGivenIfNoMatch (bool) : If no match for styleString is found and this is true, the function will return styleString, otherwise it will return tradingview's preferred default
Returns: The string expected by tradingview functions
getTime(hourNumber, minuteNumber)
Given an hour number and minute number, adds them together and returns the sum. To be used by getLevelBetweenTimes when fetching specific price levels during a time window on the day.
Parameters:
hourNumber (int) : The hour number
minuteNumber (int) : The minute number
Returns: The sum of all the minutes
getHighAndLowBetweenTimes(start, end)
Given a start and end time, returns the high or low price during that time window.
Parameters:
start (int) : The timestamp to start with (# of seconds)
end (int) : The timestamp to end with (# of seconds)
Returns: The high or low value
getPremarketHighsAndLows()
Returns an expression that can be used by request.security to fetch the premarket high & low levels in a tuple.
Returns: (tuple)
getAfterHoursHighsAndLows()
Returns an expression that can be used by request.security to fetch the after hours high & low levels in a tuple.
Returns: (tuple)
getOvernightHighsAndLows()
Returns an expression that can be used by request.security to fetch the overnight high & low levels in a tuple.
Returns: (tuple)
getNonRthHighsAndLows()
Returns an expression that can be used by request.security to fetch the high & low levels for premarket, after hours and overnight in a tuple.
Returns: (tuple)
getLineStyleFromString(styleString, acceptGivenIfNoMatch)
Tradingview doesn't give you a nice way to put the line styles into a dropdown for configuration settings. So, I specify them in the following format: "Solid", "Dashed", "Dotted", "None/Hidden". This function takes care of converting those custom strings back to the ones expected by tradingview scripts.
Parameters:
styleString (string) : Plain english (or TV Standard) version of the style string
acceptGivenIfNoMatch (bool) : If no match for styleString is found and this is true, the function will return styleString, otherwise it will return tradingview's preferred default
Returns: The string expected by tradingview functions
getPercentFromPrice(price)
Get the % the current price is away from the given price.
Parameters:
price (float)
Returns: The % the current price is away from the given price.
getPositionFromString(position)
Tradingview doesn't give you a nice way to put the positions into a dropdown for configuration settings. So, I specify them in the following format: "Top Left", "Top Center", "Top Right", "Middle Left", "Middle Center", "Middle Right", "Bottom Left", "Bottom Center", "Bottom Right". This function takes care of converting those custom strings back to the ones expected by tradingview scripts.
Parameters:
position (string) : Plain english position string
Returns: The string expected by tradingview functions
getRsiAvgsExpression(rsiLength)
Call request.security with this as the expression to get the average up/down values that can be used with getRsiPrice (below) to calculate the price level where the supplied RSI level would be reached.
Parameters:
rsiLength (simple int) : The length of the RSI requested.
Returns: A tuple containing the avgUp and avgDown values required by the getRsiPrice function.
getRsiPrice(rsiLevel, rsiLength, avgUp, avgDown)
use the values returned by getRsiAvgsExpression() to calculate the price level when the provided RSI level would be reached.
Parameters:
rsiLevel (float) : The RSI level to find price at.
rsiLength (int) : The length of the RSI to calculate.
avgUp (float) : The average move up of RSI.
avgDown (float) : The average move down of RSI.
Returns: The price level where the provided RSI level would be met.
getSizeFromString(sizeString)
Tradingview doesn't give you a nice way to put the sizes into a dropdown for configuration settings. So, I specify them in the following format: "Auto", "Huge", "Large", "Normal", "Small", "Tiny". This function takes care of converting those custom strings back to the ones expected by tradingview scripts.
Parameters:
sizeString (string) : Plain english size string
Returns: The string expected by tradingview functions
getTimeframeOfChart()
Get the timeframe of the current chart for display
Returns: The string of the current chart timeframe
getTimeNowPlusOffset(candleOffset)
Helper function for drawings that use xloc.bar_time to help you know the time offset if you want to place the end of the drawing out into the future. This determines the time-size of one candle and then returns a time n candleOffsets into the future.
Parameters:
candleOffset (int) : The number of items to find singular/plural for.
Returns: The future time
getVolumeBetweenTimes(start, end)
Given a start and end time, returns the sum of all volume across bars during that time window.
Parameters:
start (int) : The timestamp to start with (# of seconds)
end (int) : The timestamp to end with (# of seconds)
Returns: The volume
isToday()
Returns true if the current bar occurs on today's date.
Returns: True if current bar is today
padLabelString(labelText, labelStyle)
Pads a label string so that it appears properly in or not in a label. When label.style_none is used, this will make sure it is left-aligned instead of center-aligned. When any other type is used, it adds a single space to the right so there is padding against the right end of the label.
Parameters:
labelText (string) : The string to be padded
labelStyle (string) : The style of the label being padded for.
Returns: The padded string
plural(num, singular, plural)
Helps format a string for plural/singular. By default, if you only provide num, it will just return "s" for plural and nothing for singular (eg. plural(numberOfCats)). But you can optionally specify the full singular/plural words for more complicated nomenclature (eg. plural(numberOfBenches, 'bench', 'benches'))
Parameters:
num (int) : The number of items to find singular/plural for.
singular (string) : The string to return if num is singular. Defaults to an empty string.
plural (string) : The string to return if num is plural. Defaults to 's' so you can just add 's' to the end of a word.
Returns: The singular or plural provided strings depending on the num provided.
timeframeInSeconds(timeframe)
Get the # of seconds in a given timeframe. Tradingview's timeframe.in_seconds() expects a simple string, and we often need to use series string, so this is an alternative to get you the value you need.
Parameters:
timeframe (string)
Returns: The number of secondsof that timeframe
timeframeOfChart()
Convert a timeframe string to a consistent standard.
Returns: The standard format for the string, or the unchanged value if it is unknown.
timeframeToString(timeframe)
Convert a timeframe string to a consistent standard.
Parameters:
timeframe (string)
Returns: (string) The standard format for the string, or the unchanged value if it is unknown.
stringToTimeframe(strTimeframe)
Convert an english-friendly timeframe string to a value that can be used by request.security. Specifically, this corrects hour strings (eg. 4h) to their numeric "minute" equivalent (eg. 240)
Parameters:
strTimeframe (string)
Returns: (string) The standard format for the string, or the unchanged value if it is unknown.
getPriceLabel(price, labelOffset, labelStyle, labelSize, labelColor, textColor)
Defines a label for the end of a price level line.
Parameters:
price (float) : The price level to render the label at.
labelOffset (int) : The number of candles to place the label to the right of price.
labelStyle (string) : A plain english string as defined in getLabelStyleFromString.
labelSize (string) : The size of the label.
labelColor (color) : The color of the label.
textColor (color) : The color of the label text (defaults to #ffffff)
Returns: The label that was created.
setPriceLabel(label, labelName, price, labelOffset, labelTemplate, labelStyle, labelColor, textColor)
Updates the label position & text based on price changes.
Parameters:
label (label) : The label to update.
labelName (string) : The name of the price level to be placed on the label.
price (float) : The price level to render the label at.
labelOffset (int) : The number of candles to place the label to the right of price.
labelTemplate (string) : The str.format template to use for the label. Defaults to: '{0}: {1} {2}{3,number,#.##}%' which means '{price}: {labelName} {+/-}{percentFromPrice}%'
labelStyle (string)
labelColor (color)
textColor (color)
getPriceLabelLine(price, labelOffset, labelColor, lineWidth)
Defines a line that will stretch from the plot line to the label.
Parameters:
price (float) : The price level to render the label at.
labelOffset (int) : The number of candles to place the label to the right of price.
labelColor (color)
lineWidth (int) : The width of the line. Defaults to 1.
setPriceLabelLine(line, price, labelOffset, lastTime, lineColor)
Updates the price label line based on price changes.
Parameters:
line (line) : The line to update.
price (float) : The price level to render the label at.
labelOffset (int) : The number of candles to place the label to the right of price.
lastTime (int) : The last time that the line should stretch from. Defaults to time.
lineColor (color)
Al Brooks - SuiteThis indicator is designed to identify some key terms and methodologies inspired by Al Brooks price action. It helps trades to easy recognize for example i/ii/iii patterns or shaved bars defined in his books.
i/ii/iii : Single to triple inside bars. Every bar an inside bar to the previous. This can indiciate a potential contination or reversal pattern. (marked with "i")
o/oo/ooo : Single to triple outside bars. Not defined by Al Brooks, but could be an interesting area to develop a strategy. (marked with "o")
Shaved bar : A bar with little or no tail/wick on one or both sides. It can indicate strong directional movement or momentum. (marked with "s"
The timeframe is not important for the validation of the patterns.

SMC Fake Zones + InsideBarThis indicator is useful for whom trade with "Smart Money Concept (SMC)" strategy.
It helps SMD traders to identify fake or weak zones in the chart, So they can avoid taking position in this zones.
This indicator marks "Asia session" as well as "London and New York's Lunch Time (one hour before London and NY session starts)" zones.
It also marks Inside Bar candles which SMC trades consider as order flow. You can mark every Inside Bar or only those with opposite color via setting options.
*** As we know in SMC rules
1- Supply and Demand zones in "Asia session and Lunch Times" are fake zones for SMC trading and price will engulf them in most of times.
2- "Asia session high and low" has huge liquidity and usually price sweep that in London session.
This indicator will helps traders to visually identify those Fake zones and Asia session liquidity.
* You can change session times based on your time zone in settings.
* You can set options to show all Inside Bars or only with Opposite color in settings.

UtilsLibrary "Utils"
A collection of convenience and helper functions for indicator and library authors on TradingView
formatNumber(num)
My version of format number that doesn't have so many decimal places...
Parameters:
num (float) : (float) the number to be formatted
Returns: (string) The formatted number
getDateString(timestamp)
Convenience function returns timestamp in yyyy/MM/dd format.
Parameters:
timestamp (int) : (int) The timestamp to stringify
Returns: (int) The date string
getDateTimeString(timestamp)
Convenience function returns timestamp in yyyy/MM/dd hh:mm format.
Parameters:
timestamp (int) : (int) The timestamp to stringify
Returns: (int) The date string
getInsideBarCount()
Gets the number of inside bars for the current chart. Can also be passed to request.security to get the same for different timeframes.
Returns: (int) The # of inside bars on the chart right now.
getLabelStyleFromString(styleString, acceptGivenIfNoMatch)
Tradingview doesn't give you a nice way to put the label styles into a dropdown for configuration settings. So, I specify them in the following format: . This function takes care of converting those custom strings back to the ones expected by tradingview scripts.
Parameters:
styleString (string)
acceptGivenIfNoMatch (bool) : (bool) If no match for styleString is found and this is true, the function will return styleString, otherwise it will return tradingview's preferred default
Returns: (string) The string expected by tradingview functions
getTime(hourNumber, minuteNumber)
Given an hour number and minute number, adds them together and returns the sum. To be used by getLevelBetweenTimes when fetching specific price levels during a time window on the day.
Parameters:
hourNumber (int) : (int) The hour number
minuteNumber (int) : (int) The minute number
Returns: (int) The sum of all the minutes
getHighAndLowBetweenTimes(start, end)
Given a start and end time, returns the high or low price during that time window.
Parameters:
start (int) : The timestamp to start with (# of seconds)
end (int) : The timestamp to end with (# of seconds)
Returns: (float) The high or low value
getPremarketHighsAndLows()
Returns an expression that can be used by request.security to fetch the premarket high & low levels in a tuple.
Returns: (tuple)
getAfterHoursHighsAndLows()
Returns an expression that can be used by request.security to fetch the after hours high & low levels in a tuple.
Returns: (tuple)
getOvernightHighsAndLows()
Returns an expression that can be used by request.security to fetch the overnight high & low levels in a tuple.
Returns: (tuple)
getNonRthHighsAndLows()
Returns an expression that can be used by request.security to fetch the high & low levels for premarket, after hours and overnight in a tuple.
Returns: (tuple)
getLineStyleFromString(styleString, acceptGivenIfNoMatch)
Tradingview doesn't give you a nice way to put the line styles into a dropdown for configuration settings. So, I specify them in the following format: . This function takes care of converting those custom strings back to the ones expected by tradingview scripts.
Parameters:
styleString (string) : (string) Plain english (or TV Standard) version of the style string
acceptGivenIfNoMatch (bool) : (bool) If no match for styleString is found and this is true, the function will return styleString, otherwise it will return tradingview's preferred default
Returns: (string) The string expected by tradingview functions
getPercentFromPrice(price)
Get the % the current price is away from the given price.
Parameters:
price (float)
Returns: (float) The % the current price is away from the given price.
getPositionFromString(position)
Tradingview doesn't give you a nice way to put the positions into a dropdown for configuration settings. So, I specify them in the following format: . This function takes care of converting those custom strings back to the ones expected by tradingview scripts.
Parameters:
position (string) : (string) Plain english position string
Returns: (string) The string expected by tradingview functions
getTimeframeOfChart()
Get the timeframe of the current chart for display
Returns: (string) The string of the current chart timeframe
getTimeNowPlusOffset(candleOffset)
Helper function for drawings that use xloc.bar_time to help you know the time offset if you want to place the end of the drawing out into the future. This determines the time-size of one candle and then returns a time n candleOffsets into the future.
Parameters:
candleOffset (int) : (int) The number of items to find singular/plural for.
Returns: (int) The future time
getVolumeBetweenTimes(start, end)
Given a start and end time, returns the sum of all volume across bars during that time window.
Parameters:
start (int) : The timestamp to start with (# of seconds)
end (int) : The timestamp to end with (# of seconds)
Returns: (float) The volume
isToday()
Returns true if the current bar occurs on today's date.
Returns: (bool) True if current bar is today
padLabelString(labelText, labelStyle)
Pads a label string so that it appears properly in or not in a label. When label.style_none is used, this will make sure it is left-aligned instead of center-aligned. When any other type is used, it adds a single space to the right so there is padding against the right end of the label.
Parameters:
labelText (string) : (string) The string to be padded
labelStyle (string) : (string) The style of the label being padded for.
Returns: (string) The padded string
plural(num, singular, plural)
Helps format a string for plural/singular. By default, if you only provide num, it will just return "s" for plural and nothing for singular (eg. plural(numberOfCats)). But you can optionally specify the full singular/plural words for more complicated nomenclature (eg. plural(numberOfBenches, 'bench', 'benches'))
Parameters:
num (int) : (int) The number of items to find singular/plural for.
singular (string) : (string) The string to return if num is singular. Defaults to an empty string.
plural (string) : (string) The string to return if num is plural. Defaults to 's' so you can just add 's' to the end of a word.
Returns: (string) The singular or plural provided strings depending on the num provided.
timeframeInSeconds(timeframe)
Get the # of seconds in a given timeframe. Tradingview's timeframe.in_seconds() expects a simple string, and we often need to use series string, so this is an alternative to get you the value you need.
Parameters:
timeframe (string)
Returns: (int) The number of secondsof that timeframe
timeframeToString(tf)
Convert a timeframe string to a consistent standard.
Parameters:
tf (string) : (string) The timeframe string to convert
Returns: (string) The standard format for the string, or the unchanged value if it is unknown.

UDI barCandle has been divide into 3 types up bar, down bar and inside bar,
These bar classified comparing previous candle high low to current candle close.
This method used to ride the trend without exiting position.
We can use this candle color as a stop loss and take profit.
Previous candle H&L Vs Cur. Candle Close
I
U
D
------------------------
I - Inside Candle
U - Up Candle
D - Down Candle

US Market Long Horizon Momentum Summary in one paragraph
US Market Long Horizon Momentum is a trend following strategy for US index ETFs and futures built around a single eighteen month time series momentum measure. It helps you stay long during persistent bull regimes and step aside or flip short when long term momentum turns negative.
Scope and intent
• Markets. Large cap US equity indices, liquid US index ETFs, index futures
• Timeframes. 4h/ Daily charts
• Default demo used in the publication. SPY on 4h timeframe chart
• Purpose. Provide a minimal long bias index timing model that can reduce deep drawdowns and capture major cycles without parameter mining
• Limits. This is a strategy. Orders are simulated on standard candles only
Originality and usefulness
• Unique concept or fusion. One unscaled multiple month log return of an external benchmark symbol drives all entries and exits, with optional volatility targeting as a single risk control switch.
• Failure mode addressed. Fully passive buy and hold ignores the sign of long horizon momentum and can sit through multi year drawdowns. This script offers a way to step down risk in prolonged negative momentum without chasing short term noise.
• Testability. All parameters are visible in Inputs and the momentum series is plotted so users can verify every regime change in the Tester and on price history.
• Portable yardstick. The log return over a fixed window is a unit that can be applied to any liquid symbol with daily data.
Method overview in plain language
The method looks at how far the benchmark symbol has moved in log return terms over an eighteen month window in our example. If that long horizon return is positive the strategy allows a long stance on the traded symbol. If it is negative and shorts are enabled the strategy can flip short, otherwise it goes flat. There is an optional realised volatility estimate on the traded symbol that can scale position size toward a target annual volatility, but in the default configuration the model uses unit leverage and only the sign of momentum matters.
Base measures
Return basis. The core yardstick is the natural log of close divided by the close eighteen months ago on the benchmark symbol. Daily log returns of the traded symbol feed the realised volatility estimate when volatility targeting is enabled.
Components
• Component one Momentum eighteen months. Log of benchmark close divided by its close mom_lookback bars ago. Its sign defines the trend regime. No extra smoothing is applied beyond the long window itself.
• Component two Realised volatility optional. Standard deviation of daily log returns on the traded symbol over sixty three days. Annualised by the square root of 252. Used only when volatility targeting is enabled.
• Optional component Volatility targeting. Converts target annual volatility and realised volatility into a leverage factor clipped by a maximum leverage setting.
Fusion rule
The model uses a simple gate. First compute the sign of eighteen month log momentum on the benchmark symbol. Optionally compute leverage from volatility. The sign decides whether the strategy wants to be long, short, or flat. Leverage only rescales position size when enabled and does not change direction.
Signal rule
• Long suggestion. When eighteen month log momentum on the benchmark symbol is greater than zero, the strategy wants to be long.
• Short suggestion. When that log momentum is less than zero and shorts are allowed, the strategy wants to be short. If shorts are disabled it stays flat instead.
• Wait state. When the log momentum is exactly zero or history is not long enough the strategy stays flat.
• In position. In practice the strategy sits IN LONG while the sign stays positive and flips to IN SHORT or flat only when the sign changes.
Inputs with guidance
Setup
• Momentum Lookback (months). Controls the horizon of the log return on the benchmark symbol. Typical range 6 to 24 months. Raising it makes the model slower and more selective. Lowering it makes it more reactive and sensitive to medium term noise.
• Symbol. External symbol used for the momentum calculation, SPY by default. Changing it lets you time other indices or run signals from a benchmark while trading a correlated instrument.
Logic
• Allow Shorts. When true the strategy will open short positions during negative momentum regimes. When false it will stay flat whenever momentum is negative. Practical setting is tied to whether you use a margin account or an ETF that supports shorting.
Internal risk parameters (not exposed as inputs in this version) are:
• Target Vol (annual). Target annual volatility for volatility targeting, default 0.2.
• Vol Lookback (days). Window for realised volatility, default 63 trading days.
• Max Leverage. Cap on leverage when volatility targeting is enabled, default 2.
Usage recipes
Swing continuation
• Signal timeframe. Use the daily chart.
• Benchmark symbol. Leave at SPY for US equity index exposure.
• Momentum lookback. Eighteen months as a default, with twelve months as an alternative preset for a faster swing bias.
Properties visible in this publication
• Initial capital. 100000
• Base currency. USD
• Default order size method. 5% of the total capital in this example
• Pyramiding. 0
• Commission. 0.03 percent
• Slippage. 3 ticks
• Process orders on close. On
• Bar magnifier. Off
• Recalculate after order is filled. Off
• Calc on every tick. Off
• All request.security calls use lookahead = barmerge.lookahead_off
Realism and responsible publication
The strategy is for education and research only. It does not claim any guaranteed edge or future performance. All results in Strategy Tester are hypothetical and depend on the data vendor, costs, and slippage assumptions. Intrabar motion is not modeled inside daily bars so extreme moves and gaps can lead to fills that differ from live trading. The logic is built for standard candles and should not be used on synthetic chart types for execution decisions.
Performance is sensitive to regime structure in the US equity market, which may change over time. The strategy does not protect against single day crash risk inside bars and does not model gap risk explicitly. Past behavior of SPY and the momentum effect does not guarantee future persistence.
Honest limitations and failure modes
• Long sideways regimes with small net change over eighteen months can lead to whipsaw around the zero line.
• Very sharp V shaped reversals after deep declines will often be missed because the model waits for momentum to turn positive again.
• The sample size in a full SPY history is small because regime changes are infrequent, so any test must be interpreted as indicative rather than statistically precise.
• The model is highly dependent on the chosen lookback. Users should test nearby values and validate that behavior is qualitatively stable.
Legal
Education and research only. Not investment advice. You are responsible for your own decisions. Always test on historical data and in simulation with realistic costs before any live use.

NS ND - EVR - Daily Bias - TRFxVolume & Price Action Signals
What It Does
Combines three proven trading methodologies: Effort vs Result (EVR), No Supply/No Demand (NS/ND), and Daily Bias tracking for intraday traders.
Features
Effort vs Result (EVR)
- **Bullish**: Green triangle below bar when price sweeps previous low with high volume and significant wick
- **Bearish**: Red triangle above bar when price sweeps previous high with high volume and significant wick
- Identifies potential reversals where volume doesn't match price movement
No Supply / No Demand (NS/ND)
- **No Demand (Red dot)**: Up-candle with declining volume - buyers weakening
- **No Supply (Green dot)**: Down-candle with declining volume - sellers weakening
- Grey dots = unconfirmed, colored dots = confirmed within lookahead period
- Based on Volume Spread Analysis (VSA) principles
Daily Bias Label
Top-right corner shows market direction:
- **BULLISH ↑** - Closed above Previous Day High
- **BEARISH ↓** - Closed below Previous Day Low
- **BULLISH/BEARISH REV** - Swept level but closed back inside
- **RANGE ↔** - Trading between PDH/PDL
## Settings
- **EVR**: Toggle on/off, volume multiplier, wick %, inside bars, transparency
- **NS/ND**: Toggle on/off, lookahead bars (default: 10)
- **Daily Bias**: Toggle label display
## Best For
✓ Intraday trading (1m-1h timeframes)
✓ Reversal setups
✓ Volume analysis
✓ Confluence trading (all signals align)
How to Use
1. Enable components you want (all can be toggled independently)
2. Trade EVR signals in direction of Daily Bias
3. Look for NS/ND confirmation at key levels
4. Wait for colored dots (confirmed signals) over grey (unconfirmed)
**Note**: Works on intraday timeframes only. NS/ND signals may repaint during confirmation period.

ZScoreAnalysisLibrary "ZScoreAnalysis"
Z-score analysis for detecting statistical deviations and excess market behavior
calculate_zscore(source, lookback, threshold, switch_enabled)
Calculate Z-score and related metrics with history tracking
Parameters:
source (float) : Data source for Z-score calculation
lookback (int) : Lookback period for mean and standard deviation
threshold (float) : Z-score threshold for significance
switch_enabled (string) : Enable/disable switch ("Enabled"/"Disabled")
Returns: Z-score, historical significant values, and running average
get_zscore_threshold(opt, input_thr, avg)
Get threshold based on threshold option
Parameters:
opt (string) : Threshold option ("User Input Threshold", "Average as Threshold", or other)
input_thr (float) : User input threshold
avg (float) : Average threshold
Returns: Calculated threshold value
is_zscore_filtered(switch_enabled, zscore, threshold)
Check if a metric passes the Z-score filter
Parameters:
switch_enabled (string) : Enable/disable switch
zscore (float) : Current Z-score value
threshold (float) : Z-score threshold
Returns: True if filtered (exceeds threshold)
get_consecutive_distances(body_dir, breakout_dir, is_inside_bar)
Calculate consecutive distances for Z-score analysis
Parameters:
body_dir (int) : Body direction
breakout_dir (int) : Breakout direction
is_inside_bar (bool) : Inside bar flag
Returns:
get_trend_to_mean_distance()
Calculate distance from trend to mean for momentum analysis
Returns: Distance between trend and mean
get_all_zscores(lookback, threshold, bar_dist_switch, body_dist_switch, chl_dist_switch, cc_dist_switch, m_dist_switch, body_dir, breakout_dir, is_inside_bar)
Get all Z-score calculations for the indicator
Parameters:
lookback (int) : Z-score lookback period
threshold (float) : Z-score threshold
bar_dist_switch (string) : Enable bar distance Z-score
body_dist_switch (string) : Enable body distance Z-score
chl_dist_switch (string) : Enable consecutive highs/lows Z-score
cc_dist_switch (string) : Enable consecutive closes Z-score
m_dist_switch (string) : Enable momentum distance Z-score
body_dir (int) : Body direction
breakout_dir (int) : Breakout direction
is_inside_bar (bool) : Inside bar flag
Returns: Array of Z-score results and filters
get_combined_zscore_filters(z_filters)
Get combined Z-score filters
Parameters:
z_filters (map) : Map of individual Z-score filters
Returns: Various combinations of Z-score filters
get_basic_distances()
Calculate basic distances used in Z-score analysis
Returns: Bar range and body range
get_individual_zscore_filter(z_filters, filter_name)
Get individual Z-score filter by name
Parameters:
z_filters (map) : Map of Z-score filters
filter_name (string) : Name of the filter ("bar_dist", "body_dist", etc.)
Returns: Boolean filter result
has_any_zscore_signal(z_filters)
Check if any Z-score filter is active
Parameters:
z_filters (map) : Map of individual Z-score filters
Returns: True if any Z-score exceeds threshold
